Crystal from the past
Description
- Hey, Nux! Look at this crystal! It's almost as nice as a V8 engine!
- What?
- It looks like... a chrome... thingy.
- What are you talking about. Let me see.
- NO! ITS MINE! I... MUST... DRAW!
One of Nux’s weirdo friend found a mesmerizing crystal in the desert. After taking it with him, he got posessed with it. He tells weird jokes no one understands, and draws a lot on his shitty computer using an unrecognizeable graphic tablet as old as mankind. However, he won’t let you see the drawings, thus, you installed a packet sniffer on his computer.
You managed to get a pcap of one of his drawing. He starts every session by calibrating the graphic tablet. This is achieved by drawing a horizontal and a vertical line, pushing the tip of the pen (draw force calibration), and tilting the pen around.
Your task is to recover the picture he drew.
- Author: Csf3r3ncz1
- Difficulty: medium
- Attachments: calibration.pcap, challenge.pcap
Solution
I started this challenge with looking at the given calibration.pcap file inside Wireshark. I noticed the USB descriptor but since google didn’t gave me an understandable protocol description easily, I tried to understand the sent bytes in a logical manner. We knew the following from the description:
- Our guy starts with a horizontal line
- Followed by a vertical line
- Then some other calibration stuff
This meant to me, I am looking for an x and a y variable sent, signaling the pen’s position, and some other stuff, which might be handy later, e.g. force and tilt. I exported the captured data from Wireshark, and started working. (Yes I knew about PyShark, but I couldn’t make it to work, since it failed to load the data from me from the packets.) This is the script I came up with, which loads the data, and then plots it to a diagram.
#!/bin/env python3
import numpy as np
import matplotlib.pyplot as plt

file = open('./calibration.data', 'r')
#file = open('./chall.data', 'r')

data = []

#Read data from capture
for line in file.readlines():
	if ('02' in line):
		raw = line.strip('\n')
		cut = [raw[i+2:i+4] + raw[i:i+2] for i in range(0, len(raw), 4)]
		d = {
			'idk': int('0x' + cut[0],16),
			'x': int('0x' + cut[1],16),
			'y': int('0x' + cut[2],16),
			'force': int('0x' + cut[3],16),
			'tilt': int('0x' + cut[4],16)
		}
		data.append(d)

#Plot the data
for item in data:
	print(item)
	plt.scatter(item['x'], item['y'])

plt.show()
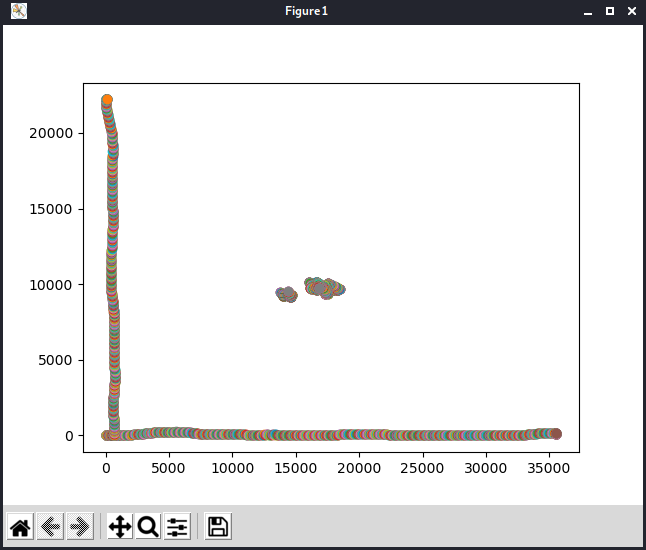
From here I started working with the real data, however on the first render it looked quite a mess. Of course, up until now I only used the x and y variables, so I figured I would tinker a little bit with the other values. This setup gave me a clear enough diagram, so I could read the flag:
for item in data:
	print(item)
	if item['x'] < 14700 and item['y'] < 9700:
		if item['tilt'] > 200 and item['force'] > 0:
			plt.scatter(item['x'], item['y'])
The acquired flag is:
cd21{HIDDEN}